Figure 7.

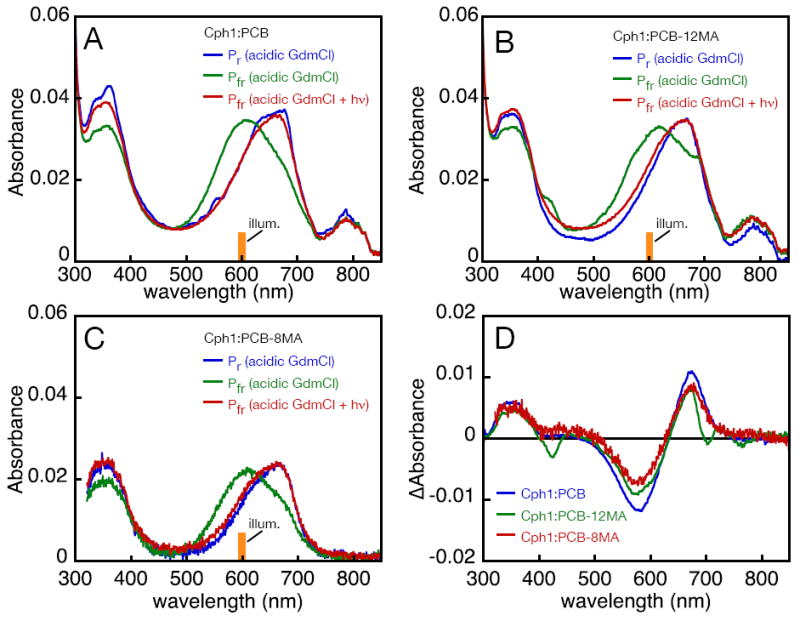
Denaturation analysis of Cph1 adducts. (A) Cph1:PCB was denatured in acidic guanidinium chloride in the native Pr (blue) or Pfr (green) states. Illumination of the denatured Pfr state with 600±5 nm light resulted in formation of a product (red) whose absorbance spectrum was equivalent to that of the denatured Pr sample. (B) Similar results were obtained with Cph1:PCB-12MA. The apparent absorbance peak at approximately 800 nm in (A) and (B) is associated with a contaminant in some lots of guanidine hydrochloride and is photochemically inert (not shown). (C) Similar results were obtained with Cph1:PCB-8MA. (D) Difference spectra are shown for photoconversion of the denatured Pfr adducts of Cph1:PCB (blue), Cph1:PCB-12MA (green), and Cph1:PCB-8MA (red).
