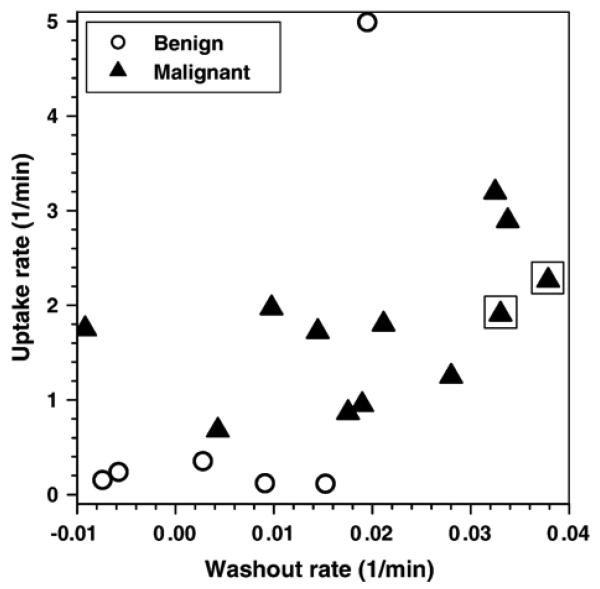
Fig. 3.
Plot of uptake rate (α) versus washout rate (β) obtained by fitting the contrast concentration curves with the EMM for 6 benign lesions and 12 malignant lesions. Triangles inside squares indicate IDC. There is clear separation between benign and malignant lesions, although one of the benign lesions is an outlier.

