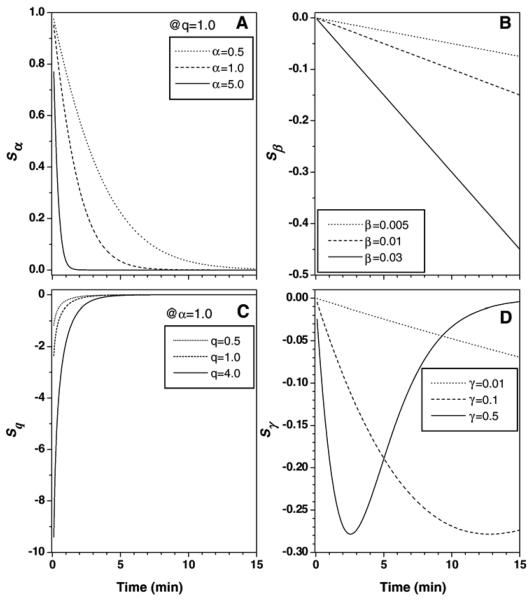
Fig. 6.
(A–D) Plot of sensitivities of four parameters of the EMM based on Eqs. (12)-(15). The vertical axis is unitless and corresponds to changes in C(t) due to variations in each parameter. The a value used in simulations does not cover the range seen in the data because decay was too rapid at larger α values.

