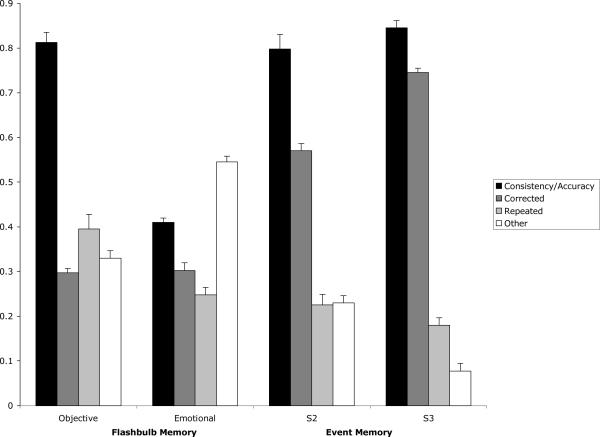
Figure 2.
For flashbulb memories, the proportion of consistent responses on Survey 2 that remained consistent on Survey 3 (as indicated by consistency/accuracy), as well as the proportion of inconsistent responses on Survey 2 corrected, repeated, or given another response on Survey 3. For event memory, the proportion of accurate responses on Survey 1 accurate on Survey 2 (S2: consistency/accuracy), the proportion of accurate responses on Survey 2 that were also accurate on Survey 3 (S3: consistency/accuracy), the proportion of inaccurate responses on Survey 1 corrected, repeated or given another response on Survey 2, and the proportion of inaccurate responses on Survey 2 corrected, repeated or given another response on Survey 3. Standard deviations are expressed in error bars.

