
Figure 2.
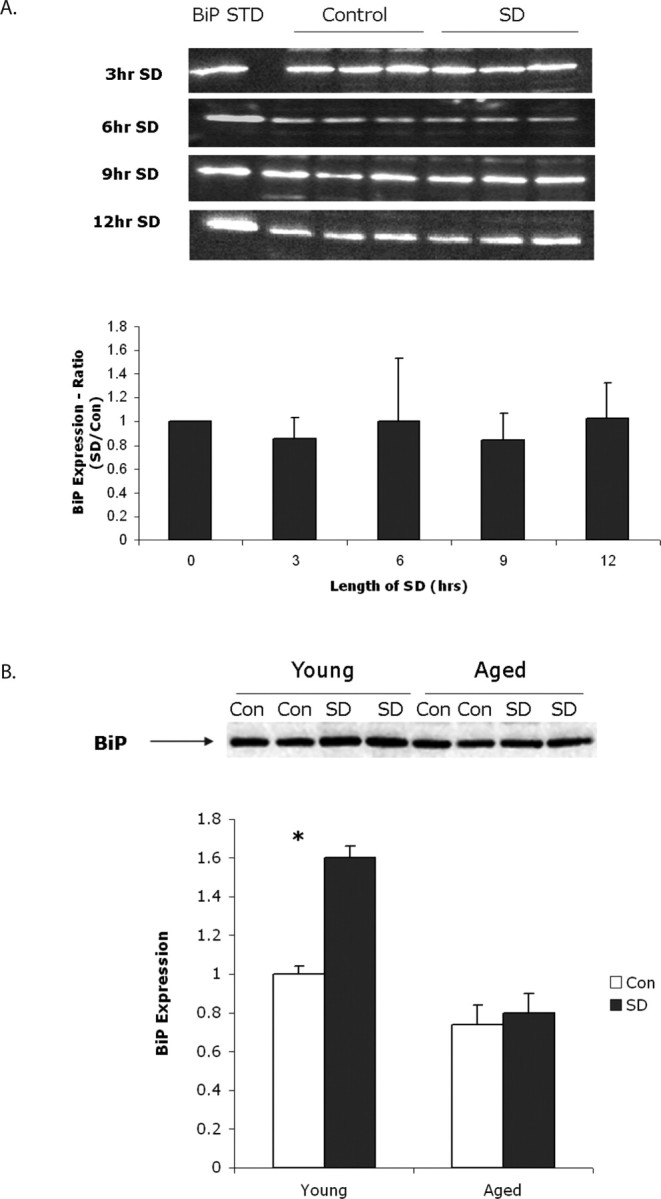
A, Top, Representative Western blots showing BiP expression in aged mouse cerebral cortex after 3, 6, 9, and 12 h of sleep deprivation (SD). Each blot shows a triplicate of a single sleep-deprived mouse lysate and its matching undisturbed control. There were eight gels run at each time point. All bands were normalized to an external commercial BiP standard (STD) run on each gel. Bottom, Densitometric quantification of BiP expression directly from chemiluminescence at 3, 6, 9, and 12 h of sleep deprivation. Averaged data with standard deviation are presented as a ratio to undisturbed controls killed at the same diurnal time. n = 8 per time point. These ratios were not significantly different than 0 h. B, Top, Representative Western blot showing BiP expression in two young and two aged mice cerebral cortices after 6 h of sleep deprivation compared with two young and two aged undisturbed mice killed at the same diurnal time. Bottom, Graph showing quantification of BiP expression from six sleep-deprived and control (Con) young and aged animals. Data are expressed as a ratio of sleep deprived to young control. Averaged data with standard deviations are shown. There is a significant increase in BiP in young animals but not in old (*p = 0.0001).