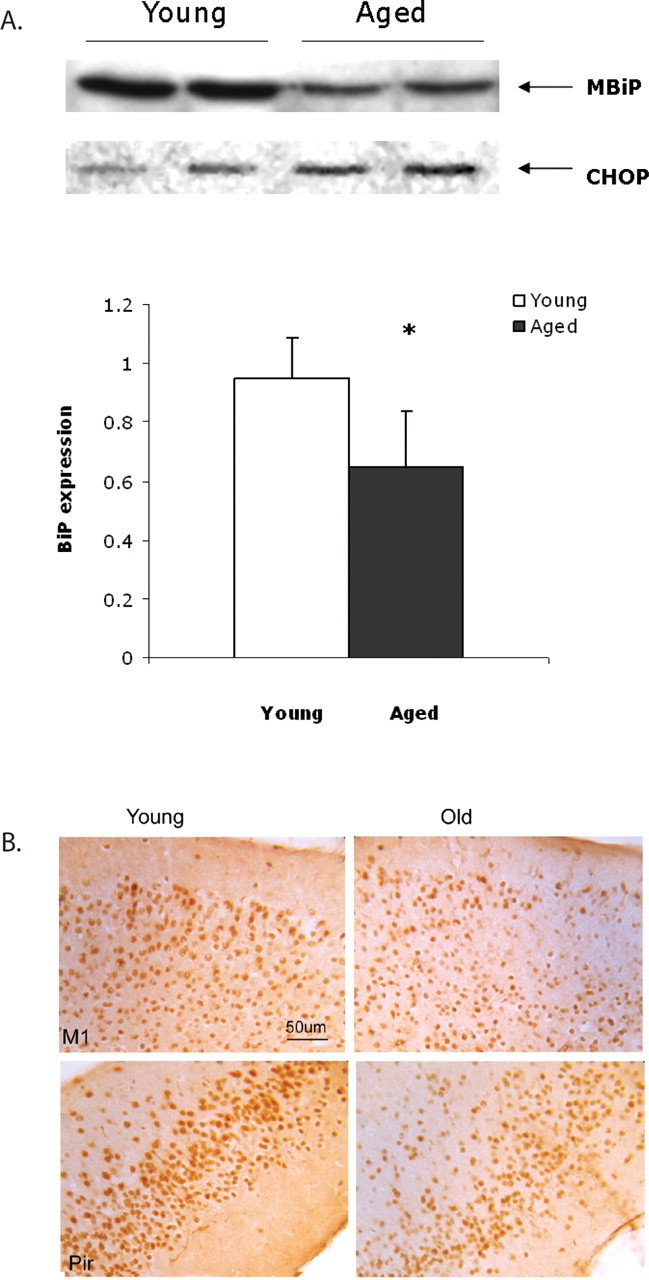
Figure 3.

A, BiP expression is lower in aged mouse cerebral cortex. BiP expression in two young and two aged samples from the 1:00 P.M. time point are shown in a representative Western blot. CHOP, which increases with age, is shown as a loading control. The bar graph below illustrates BiP expression quantified from Western blots in young and aged tissue. Mean with SD is shown (n = 6; *p = 0.01). B, Decreased immunohistochemical labeling of BiP in with age. DAB-labeled BiP in young and aged M1 and piriform (Pir) cortical neurons. 160× magnification. Scale bar, 50 μm.
