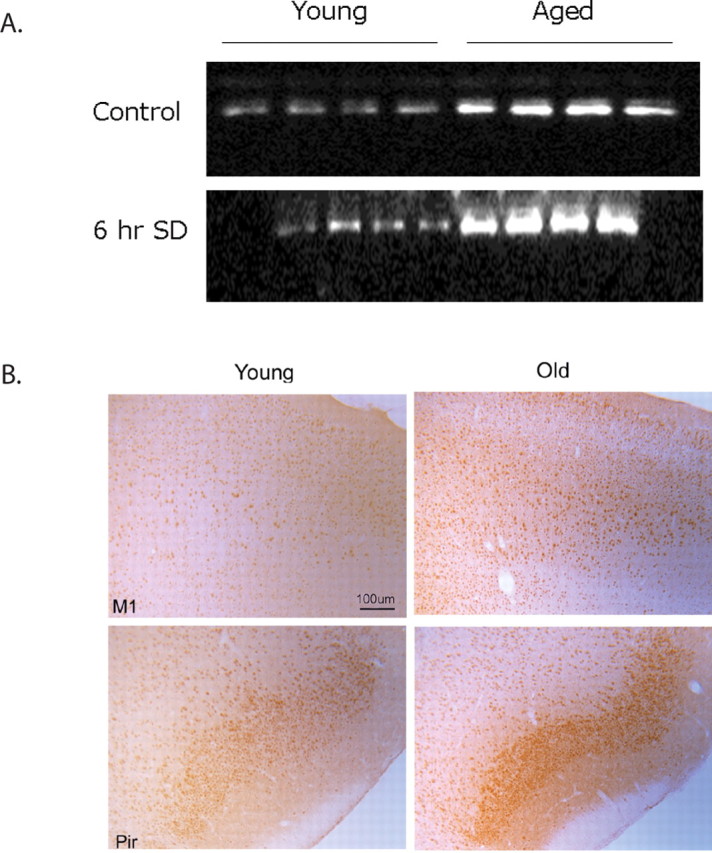
Figure 6.

A, Western blot showing CHOP expression in young and aged control and sleep-deprived samples. CHOP levels are markedly higher in aged animals compared with young. With sleep deprivation, there was an additional increase in CHOP levels in aged animals but not in young. Each gel shows samples (20 μg of protein) from four individual young and aged animals. B, Increased expression of CHOP with age. DAB-labeled CHOP in young and aged M1 and piriform (Pir) neurons. 80× magnification. Scale bar, 100 μm (for all images).
