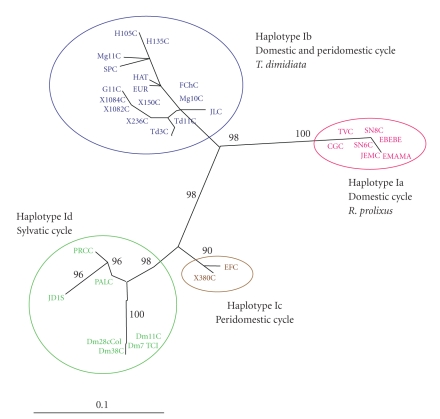
Figure 2.
Unrooted phylogenetic tree depicting the evolutionary relationships among T. cruzi I isolates. The tree was constructed by the maximum likelihood method. Numbers in larger fonts represent the bootstrap values for the main cluster of the haplotypes. The topology obtained for this method represents the consensus from 236 trees (100 replicates each producing, on average, 4 most parsimonious trees), bootstrap 50% majority rule consensus.

