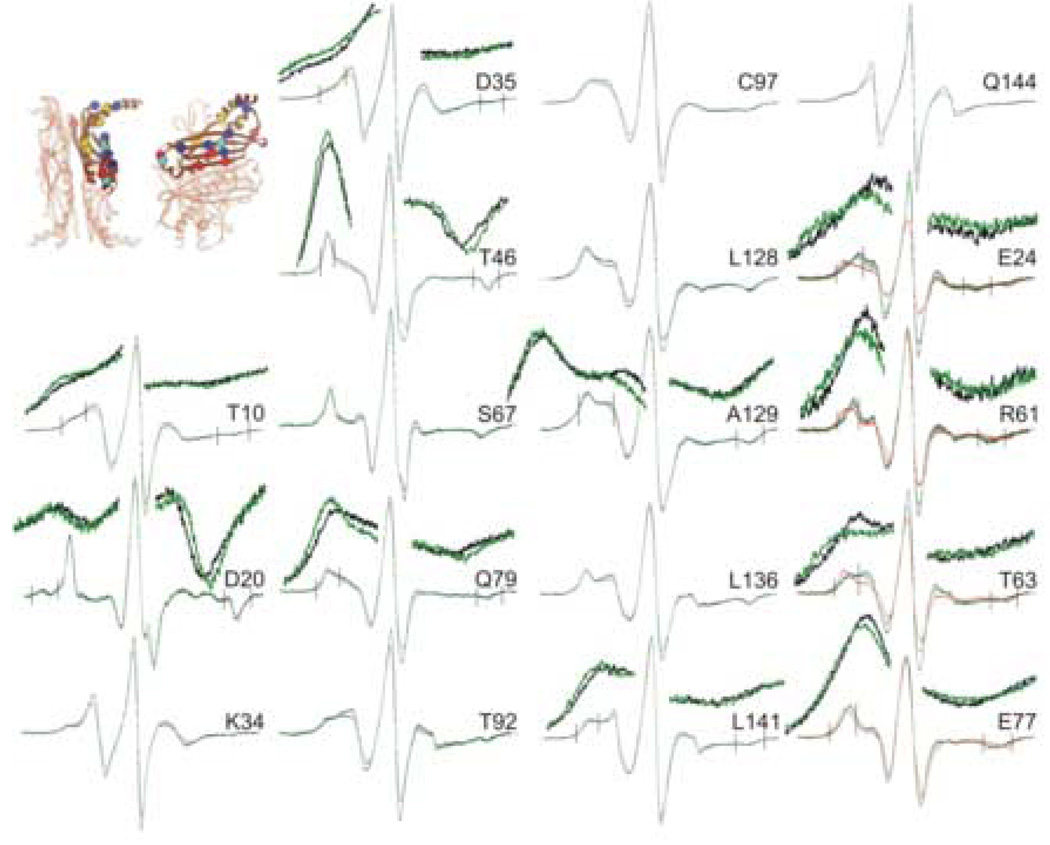
Figure 5.
Positions on SecB that show significant constraint. The black traces are spectra of spin-labeled SecB alone, the red are spectra of an equimolar mixture of SecA and spin-labeled SecB and the green are an equimolar mixture of spin-labeled SecB and unfolded precursor galactose-binding protein. The positions of the residues examined are shown on the structure of SecB as spheres at the site of the α-carbon atom. The key to the colors is described in Figure 4. The insets show the region of the extrema, indicated by the vertical lines, magnified by a factor of four for both the intensity and the field.

