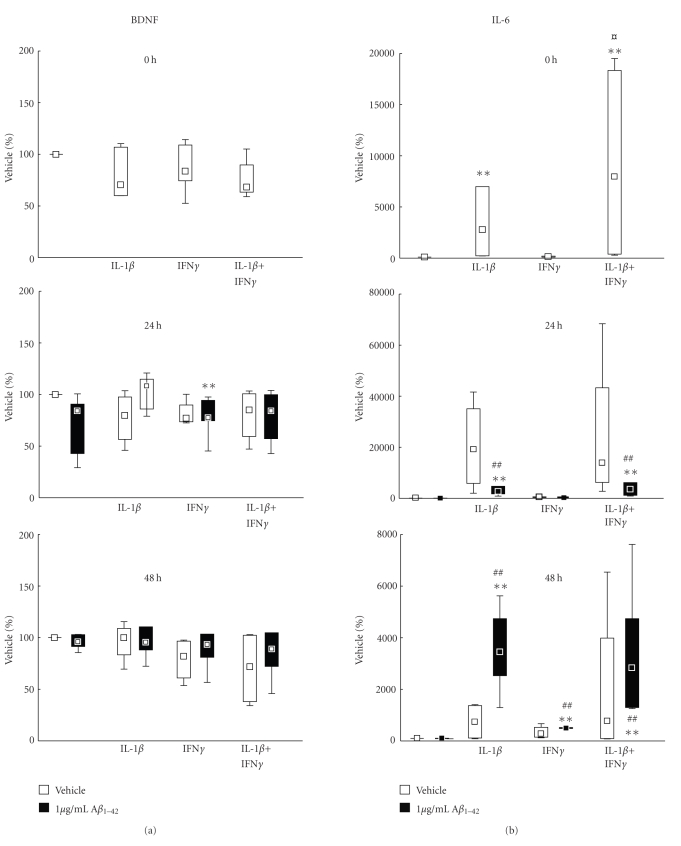
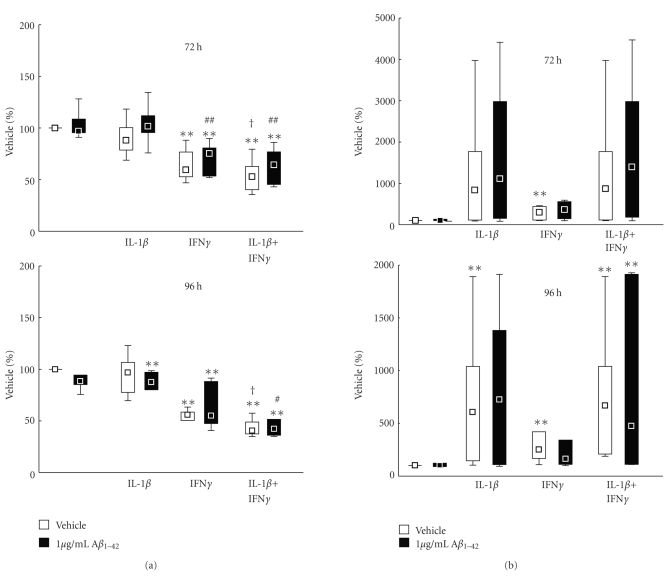
Figure 5.
(a)-(b) Effects of incubation with interleukin-1β (IL-1β) and interferon-γ (IFNγ), added 24 hours before incubation with 1 μg/mL Aβ 1–42 (black boxes) or vehicle (white boxes), on secreted levels of IL-6 (a) and BDNF (b) from CHME3 microglial cells. The cells were incubated with 1 μg/mL HiLyte488-conjugated Aβ 1–42 following prestimulation for 24 hours with 50 ng/mL IL-1β and 50 ng/mL IFNγ. The cells were harvested at 24, 48, 72, and 96 hours after addition of Aβ 1–42. The data are expressed as % uptake of control vehicle set at 100% and shown as median ± percentiles (25%–75% and 10%–90%), n = 4 for 24 hours and 48 hours and n = 6 for 72 and 96 hours. A statistically significant effect of treatment was found by Kruskal-Wallis ANOVA at 24 hours (P = .0087), at 72 hours (P = .004), and at 96 hours (P = .004). Statistical difference from control is indicated by **(P < .01); difference from Aβ 1–42 # is indicated by (P < .05) and ##(P < .01). † indicates statistical difference (P < .05) between IL-1β and IL-1β + IFNγ.


