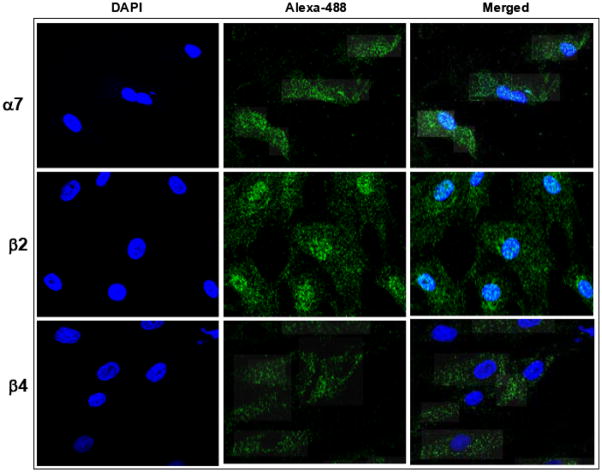
Figure 2.
Expression of nAChR proteins in hMSCs. The nAChR subunits were visualized by immune fluorescence. Nuclei were stained with DAPI (blue). To visualize binding of nAchR sub-unit specific antibodies, secondary Alexa-488 labeled antibodies were used (green). Merged images are shown in the right panel. The images are representative of five separately stained slides with hMSC.

