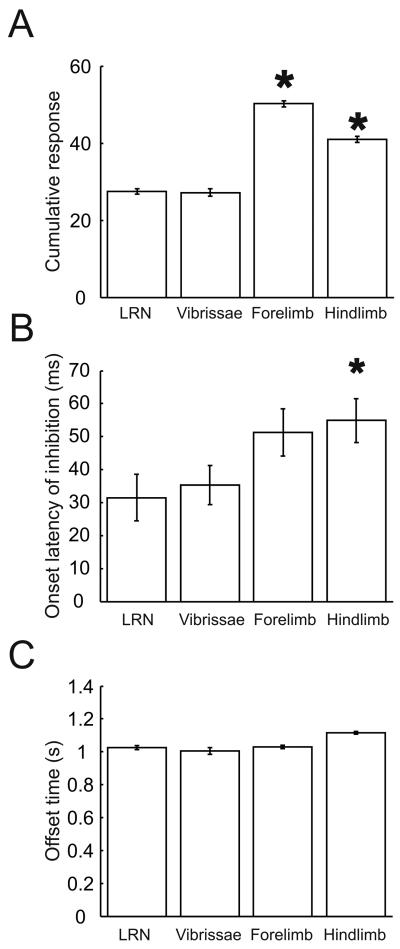
Figure 3.
Comparison of Golgi cell responses elicited from peripheral stimulation and LRN stimulation. Comparison of the size (A), mean onset latencies of pure inhibitory responses (B), and mean offset latencies (C) of Golgi cell responses to peripheral and LRN stimulation. * indicates statistical significance at 5% confidence interval with LRN stimulation (P<0,05, upaired Student's t-tests).

