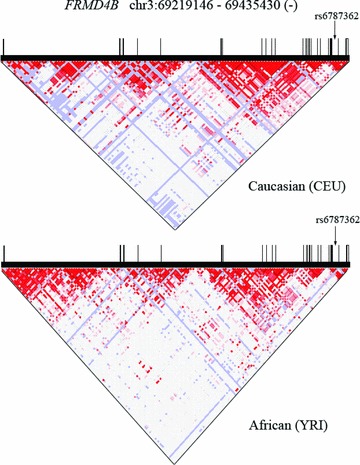
Figure 1.

FRMD4B gene structure, known polymorphisms, and linkage‐dissociation plot. Data were obtained from HapMap. Vertical black bars represent exons; bar width is proportional to exon size. Top graph is for Caucasian Europeans (CEU); bottom is Africans (YRI). Arrow indicates position of seminal SNP rs6787362 in intron 21.
