Figure 5.
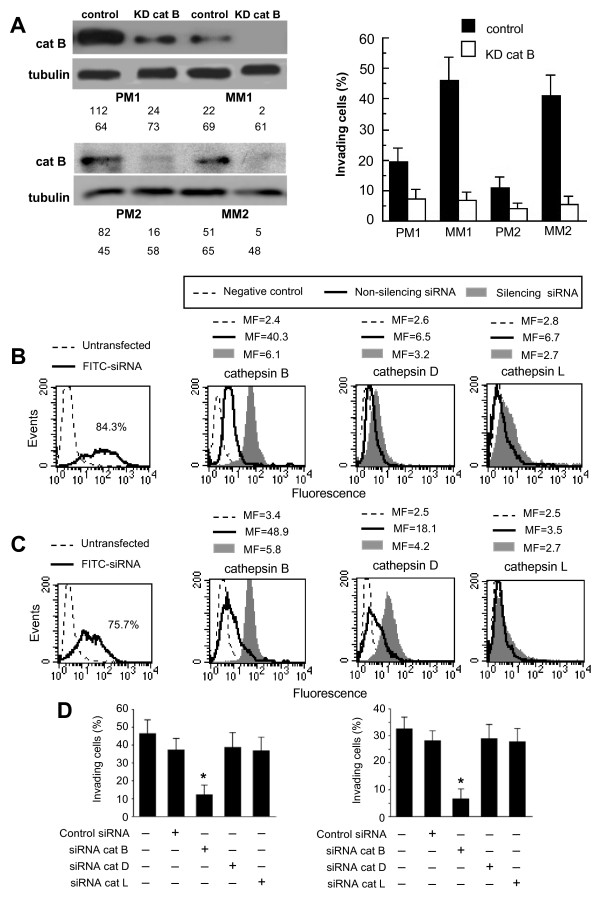
Cathepsins and in vitro invasiveness: effect of siRNA. (A) Western blot analysis of cathepsin B (left panels) and invasion test (right panel) of cells knocked down for cathepsin B in two different primary (PM1 and PM2) and metastatic (MM1 and MM2) melanoma cell lines. The values of Western blot signals, reported in the bottom left panels, were obtained by densitometric analysis and are expressed as arbitrary units (a.u.). In vitro invasion test (right panel) in cells knocked down for cathepsin B showed a significant (p < 0.01) reduction of their invasion capability. Data are reported as mean ± SD of the percentage of invading cells obtained in three independent experiments. Two representative primary or metastatic melanoma cell lines are shown. (B and C) Flow cytometry evaluation of fluorescence in MM1 cells (B) or MM4 cells (C) transfected with FITC-siRNA. The number in the left panel represents the percentage of FITC-positive cells (corresponding to transfected cells). Cytofluorimetric evaluation, performed 48 h after transfection, of cathepsin B (second panel), D (third panel) or L (fourth panel) in MM1 (B) and MM4 (C) cells transfected with non-silencing siRNA or with silencing siRNA. Numbers represent the median fluorescence intensity and indicate the expression level of the cathepsins. A representative experiment among three is shown. (D) Invasion test of cells knocked down for cathepsins in MM1 (left panel) and in MM4 (right panel) cell lines. (*) Indicates p < 0.01.

