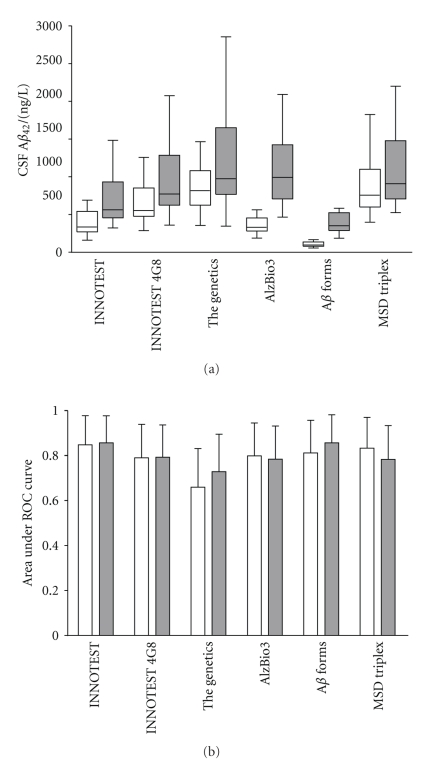
Figure 4.
(a) Boxplot (whiskers represent minutes and max values) of CSF Aβ 42 concentrations using different assays. For each kit the CSF was analyzed twice, neat and threefold diluted in a detergent-containing buffer. Each box represents 40 samples (20 AD + 20 controls). (b) Area under ROC curve for different assays with whiskers representing a 95% confidence interval. Neat, and threefold diluted CSF are represented by white and dark boxes/bars, respectively.

