Figure 6.
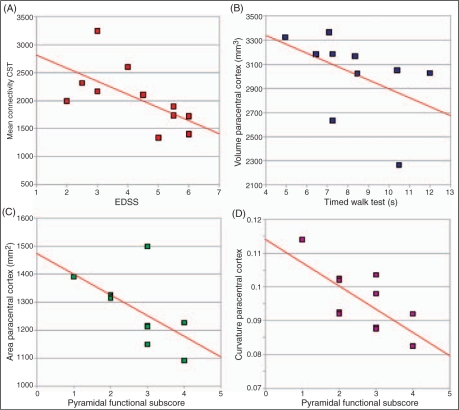
Graphs showing the correlations between A: corticospinal tract (CST) connectivity and Expanded Disability Status Scale (EDSS), B: volume of the paracentral cortex and timed walk test (TWT), C: surface area of the paracentral cortex and pyramidal functional system (FS) subscore, and D: curvature of the paracentral cortex and pyramidal FS subscore. Regression lines are shown on each scatter plot.

