
Figure 5.
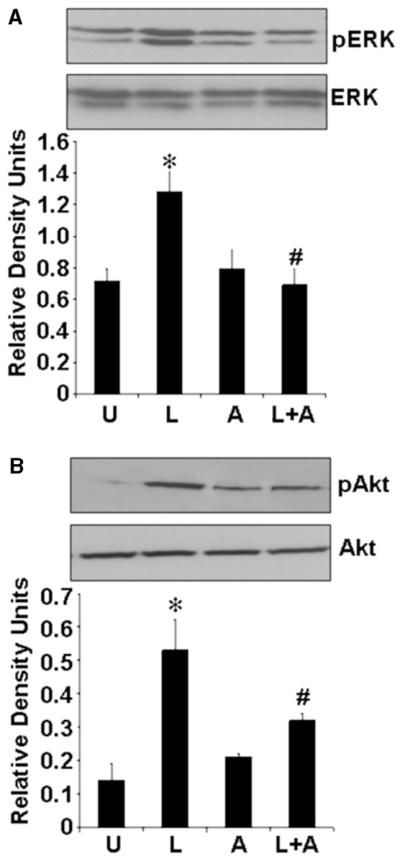
Leptin was incapable of inducing phosphorylation of ERK and AKT in the absence of JAK/STAT activation. ECC1 were cultured, serum starved for 16 h and stimulated with 100 ng/ml leptin (‘L’) or 100 μM AG490 (A). For combined treatment, cells were pretreated with 100 μM AG490 for 45 min followed by leptin treatment (‘L+A’). Untreated controls are designated as ‘U’. Total proteins were immunoblotted with specific antibody against total or phosphorylated (p) forms of ERK (A) and AKT (B). The representative histograms are the densitometric analysis of bands demonstrating fold increases in levels of phosphorylated ERK and phosphorylated AKT with respect to total ERK and AKT respectively. *P < 0.01, compared with untreated (‘U’) control cells; #P < 0.01, compared with leptin (‘L’) treatment.