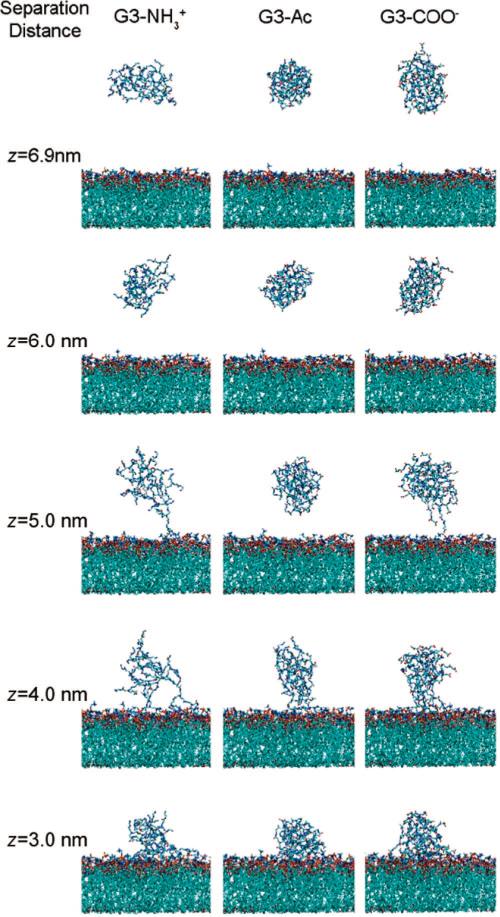
Figure 2.
Images of G3–NH3+, G3–Ac, and G3–COO– at center-of-mass separation distances of 6.9, 6.0, 5.0, 4.0, and 3.0 nm from the DMPC bilayer. For z > 6 nm, there is no interaction between the dendrimers and lipids. At z = 3 nm the dendrimers are near the equilibrium separation, as determined by the potential of mean force (PMF) (Figure 3). Notice the variation in dendrimers’ size, shape, and density, as quantified in Figures 5 and 6. Animations of dendrimers binding to the DMPC bilayer are found in the Supporting Information.

