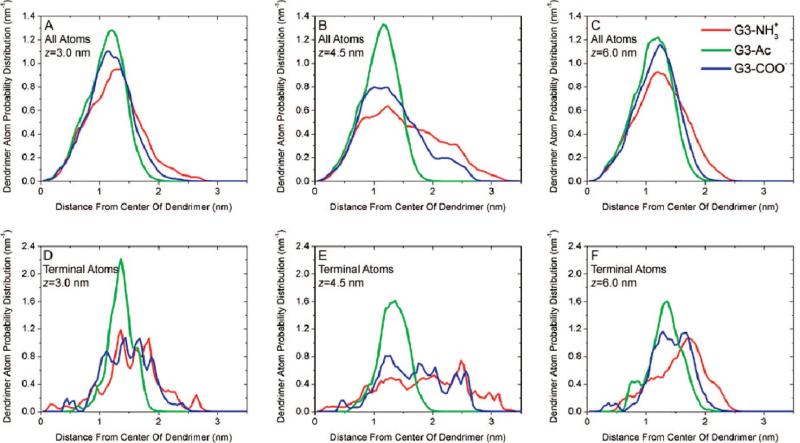
Figure 6.
Atomic distributions for G3–NH3+, G3–Ac, and G3–COO– at varying interaction coordinates. The vertical axis is a normalized probability distribution of (A–C) all dendrimer atoms or (D–F) the 32 most terminal carbon or nitrogen atoms in each dendrimer. The horizontal axis is the radial distance from dendrimer center of mass. Results have been averaged over a 4 ns simulation within each sampling window: (A and D) z = 3.0 nm, (B and E) z = 4.5 nm, and (C and F) z = 6.0 nm.

