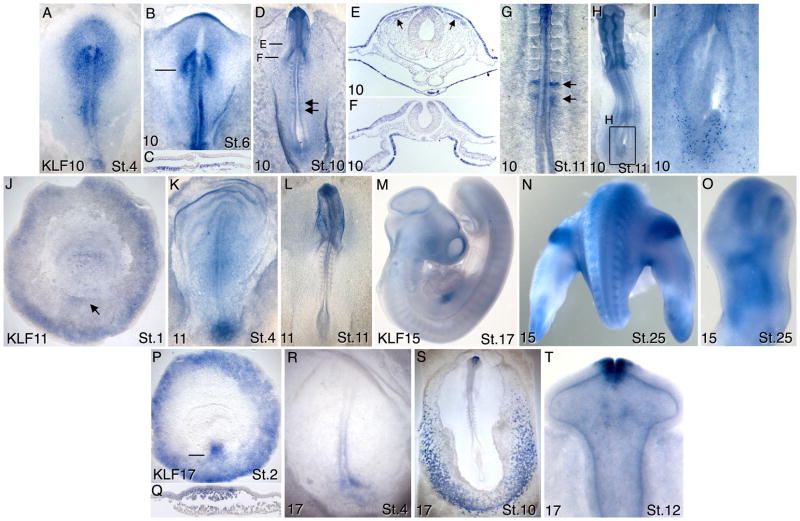
Figure 4.
Expression patterns of KLFs 10, 11, 15 and 17 in chicken embryos between stages 1–26. A–I) KLF10; E–F) transverse sections through embryo in D); arrows in D) and G) show expression in the forming somites; arrows in E) show migrating cranial neural crest. I) Magnification of boxed region in H), showing staining of individual endoderm cells. J–L) KLF11; arrow in J) points to Koller’s sickle. M–O) KLF15; P–T) KLF17; Q) transverse section of embryo in P) at the indicated level. See text for detailed descriptions of these expression patterns.

