
Figure 8.
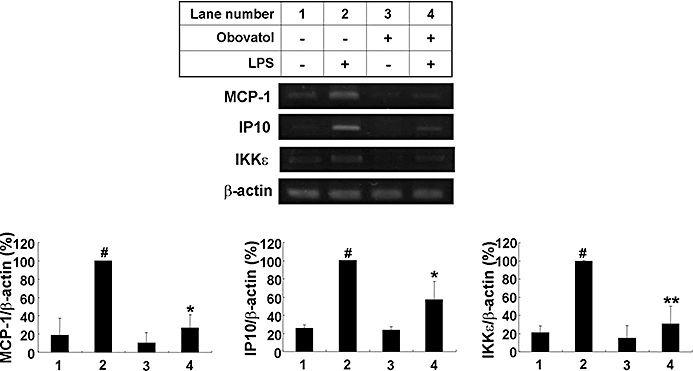
Re-evaluation of microarray-based differential gene expression by RT-PCR. BV-2 microglia cells were stimulated with 100 ng·mL−1 LPS in the absence or presence of 10 µM obovatol for 6 h. After treatment, total RNA was isolated and subjected to DNA microarray analysis. The expression of MCP-1, IP10 and IKKε genes was assessed by RT-PCR (upper). Levels of MCP-1, IP10 and IKKε were normalized to β-actin levels and expressed as a relative change in comparison with the LPS treatment, which was set to 100% (lane 2) (lower). The data were expressed as the mean ± SD (n= 3). #P < 0.01 versus untreated control; *P < 0.05, **P < 0.01 versus LPS only. RT-PCR, reverse transcription-polymerase chain reaction; LPS, lipopolysaccharide; MCP, monocyte chemotactic protein; IP10, interferon-inducible protein 10; IKK, inhibitor of kappaB kinase.