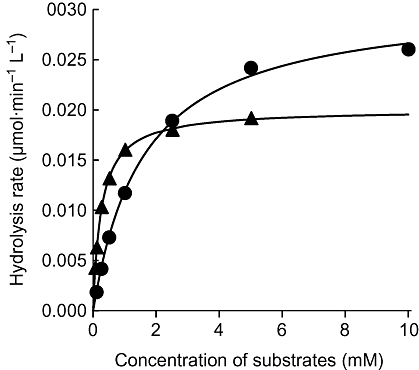
Figure 2.

Initial hydrolysis rates of MP4A and MP3B_R by human AChE and BChE, respectively, at various substrate concentrations. Observed value of MP4A (circles) and MP3B_R (triangles), and regression curves based on Michaelis–Menten kinetics are presented. Each value was measured in duplicate.
