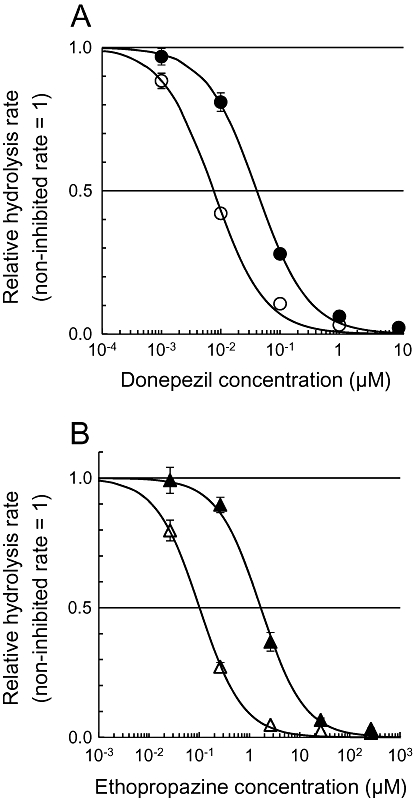
Figure 6.

Inhibition of AChE and BChE by donepezil (A) and ethopropazine (B), respectively, in different concentrations of human whole blood (solid symbols, 0.83 mL blood·mL−1; open symbols, 0.0083 mL blood·mL−1). The values are presented as non-inhibited hydrolysis rates of [14C]MP4A (A) and [14C]MP3B_R (B) = 1. Regression curves based on Equation 7 (see Methods section) are presented.
