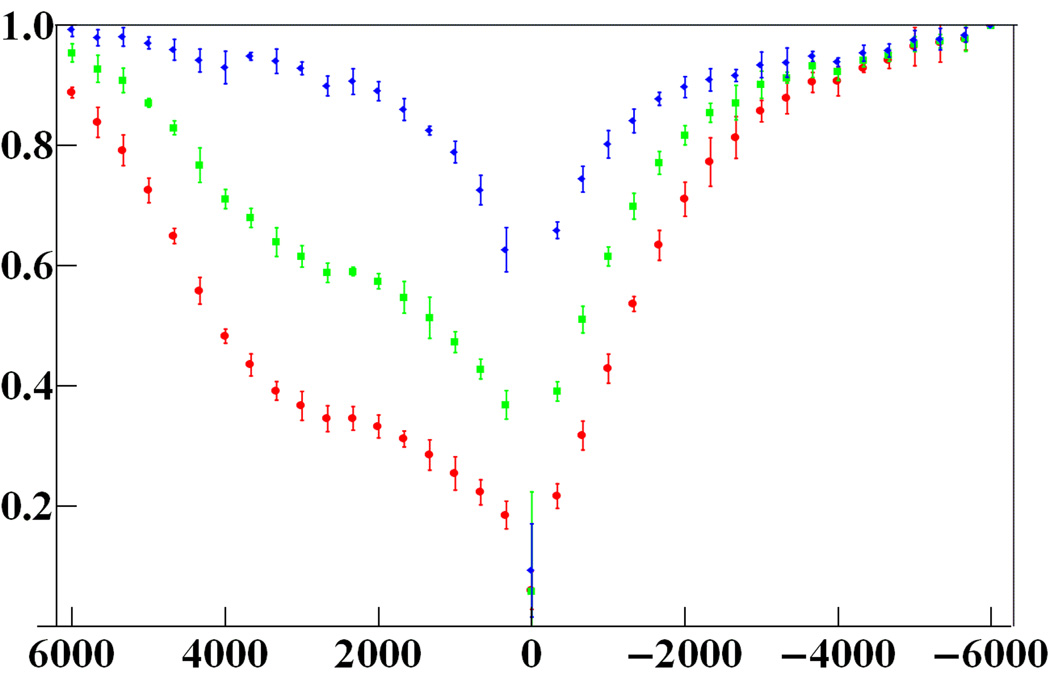
FIG. 3.
CEST-spectra. Y-axis: observed signal divided by signal with saturation pulse 6 kHz below water resonance. X-axis: saturation pulse frequency relative to water (Hz). Top to bottom: water with 0, 20, 60 mM Eu (III)−1,4,7,10-tetrazacyclododecone−1,4,7,10-tetrakis (acetamidoacetic acid). Plotting symbols are the mean signal from the five slices imaged at once. Error bars extend ±4 standard deviations from the means.

