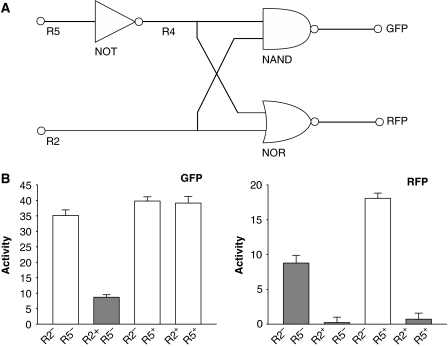
Figure 3.
(A) Diagram of the demonstration circuit. Labels directly under the wires represent repressors carrying the respective input and intermediate signals. GFP and RFP refer to the green and red fluorescence proteins reporting outputs, respectively. (B) Theoretical and experimental outputs of the circuit in response to different inputs. White bars correspond to ‘ON' outputs expected by theory and gray bars correspond to ‘OFF' outputs expected by theory. Activities are reported as slopes obtained from linearly fitting fluorescence versus OD600. Error ranges are root mean square residuals of the respective fittings. Source data is available for this figure at www.nature.com/msb.

