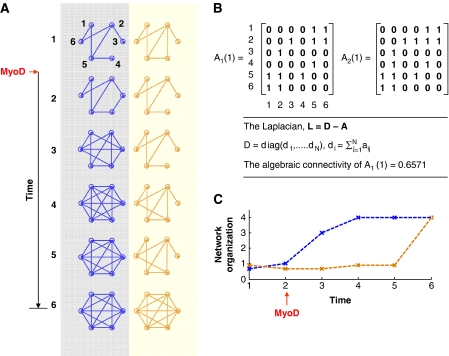
Figure 2.
A quantitative view of how spatial arrangement of chromosomes may influence gene expression, and may precede nuclear reprogramming. (A) The blue networks on the left represent chromosomal spatial arrangement over six time points during reprogramming or differentiation, and the yellow networks represent gene expression. (B) Each connection (edge) between nodes within the networks in (A) at the first time point is assigned a value of one, and absence of an edge is assigned a value of zero in the unweighted adjacency matrices shown. This can be easily extended to the weighted case, where an edge can be assigned numerical values according to the strength of the connection. Equations for the computation of algebraic connectivity between adjacency matrices are given and are plotted in (C) for the six time points. In this case, the network organization is initially similar, but the chromosomal network precedes the expression network in organization. After the fifth time point, the two networks, possibly by an iterative communication process, converge on a unique steady state. This concept is also illustrated in Figure 3, where the initial networks at time point 1 exist within steady state 1, and the final networks at time point 6 exist within steady state 2.

