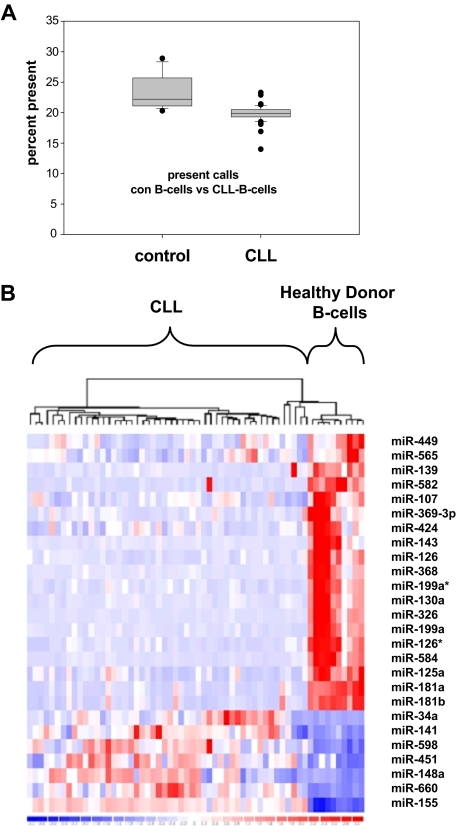
Figure 1.
miRNA expression profiling of CLL patient samples and healthy donor B cells. (A) Significant decrease of expressed miRNA in CLL cells (n = 50) versus healthy donor B cells (n = 14; P < .001) shown as percentage of present calls. (B) Heat map of microRNA expression patterns in CLL cells versus healthy donor B cells: 26 miRNAs are significantly deregulated in CLL versus healthy control, 19 miRNAs show down-regulation in CLL and 7 miRNAs were demonstrated to be up-regulated.

