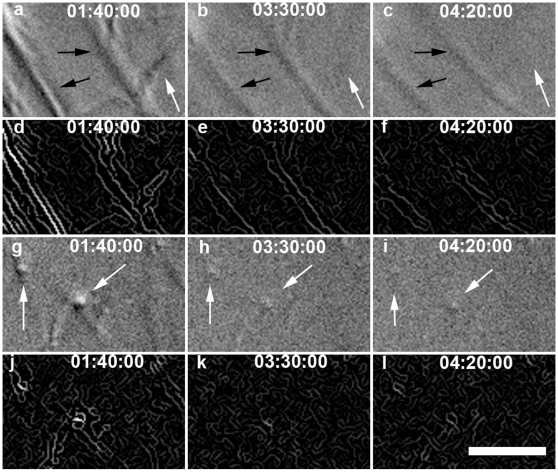
Figure 1. DIC and Edge detection results for loaded ROI #8 (A–F) and unloaded ROI #4 (G–L) from Fig. 5.
(A–C, G–I) DIC image series of degradation, with intensity adjusted. (D–F, J–L) Edge detected intensity image series of degradation. In strained ROI#8, the direction of strain, and the orientation of the predominant strained fibrils, is northwest-southeast (compare with Fig. 5). Black arrows denote strained fibrils, white arrows denote unstrained fibrils. Note how quickly the perpendicular, unstrained fibrils (seen as high contrast dots) fade compared to strained fibrils. Also note relatively unstrained fibrils in the strained ROI degrade much faster than strained fibrils. Bar = 5 µm. (see SI movie for video of this sequence and accompanying text).

