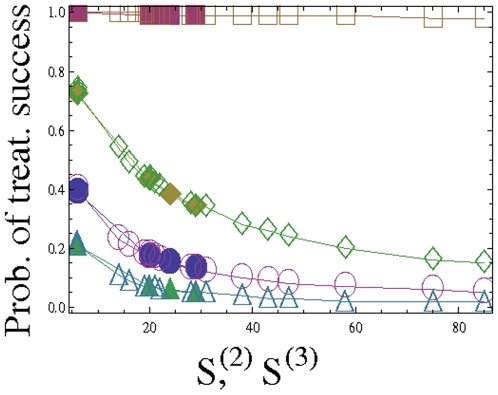
Figure 2. The probability of treatment success as a function of the numbers  and
and  .
.
Different markers correspond to different treatment parameters: circles (division rate L = 10, death rate d = 9, drug-induced death rate hi = 10, mutation rate u = 10−7, cancerous population size at the start of treatment N = 1010), squares ( ), diamonds (
 ), triangles (
 ). Empty markers denote three-drug treatments, and solid ones – two-drug treatments. The data are presented in tables 5 and 6.

