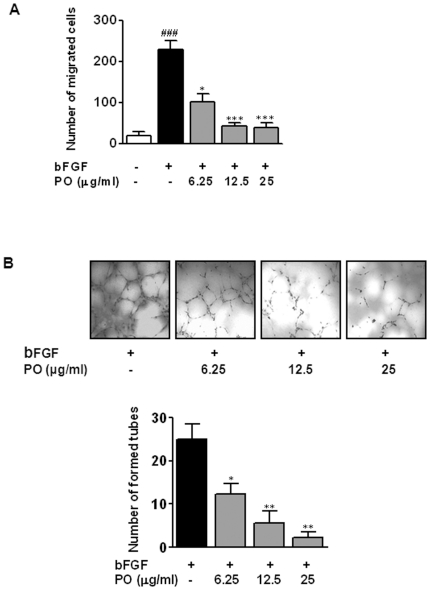
Figure 3. PO inhibits bFGF-induced migration and tube formation of HUVECs.
Cell migration through gelatin-coated filters was measured by using the Boyden chamber. HUVECs (5×10⁴ cells/well) were plated into the upper chamber with or without various concentrations of PO and incubated for 6 h at 37°C in a 5% CO2 incubator. Cells migrated to the lower surface were photographed randomly under an Axiovert S 100 light microscope at ×100 magnification and counted. (B) Tube formation assay was performed using growth factor reduced Matrigel. Cells were fixed with Diff-Quick solution, photographed randomly under an Axiovert S 100 light microscope at ×100 magnification and counted. All data were expressed as mean ± S.D. The statistically significant differences between control and PO treated groups were calculated by the Student's t-test. ###, p<0.001 versus untreated control.*, p<0.05 and **, p<0.01 versus bFGF control.

