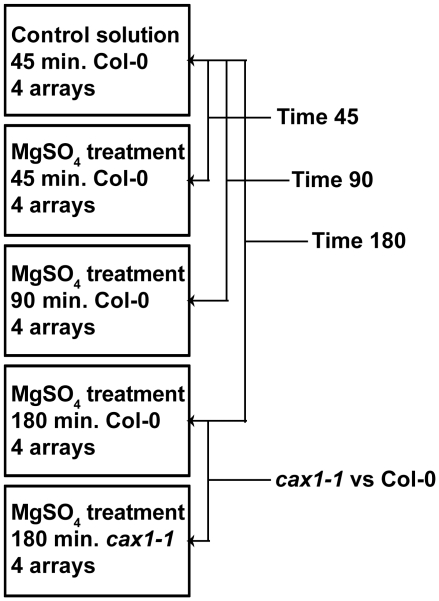
Figure 3. Overview of the microarray experiment.
The experiment included 20 arrays in total, each with a single cy3-labeled sample hybridized to it. Each sample set consisted of 4 biological replicates. Gene expression was compared among the sets as indicated by the arrows; Col-0 sets treated for 45 min., 90 min., or 180 min. were compared to the Col-0 set exposed to a control solution for 45 min., and these three comparisons are referred to in the text, tables and figures as Time 45, Time 90, and Time 180 respectively. The comparison of cax1-1 with Col-0 treated for 180 min. is not referred to in abbreviated form.

