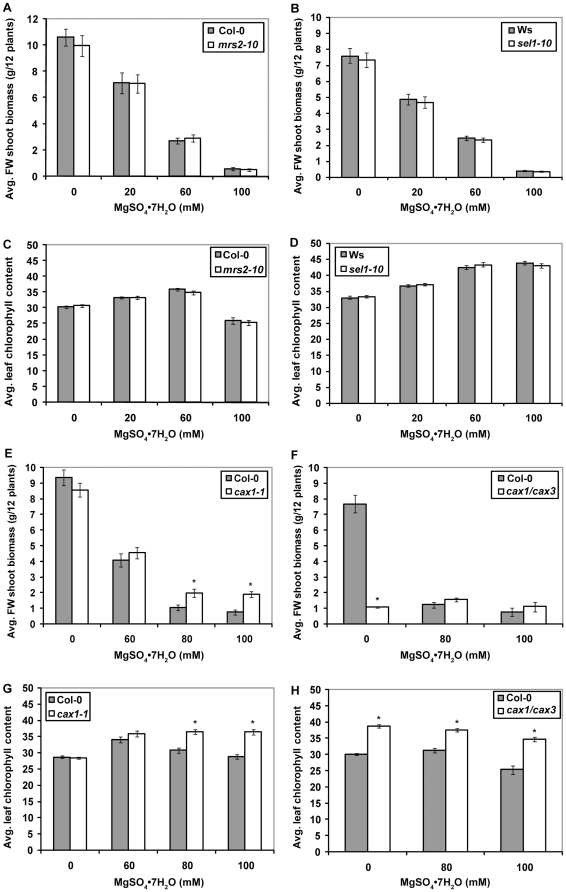
Figure 5. The shoot fresh weight biomass comparisons of mutant and wildtype lines grown on soil.
Average fresh weight shoot biomass of (a) mrs2-10 and Col-0, (b) sel1-10 and Ws, (e) cax1-1 and Col-0, or (f) cax1/cax3 and Col-0 plants in response to increasing concentrations of MgSO4·7H2O in soil medium. Bars indicate standard error, n = 12. Average leaf chlorophyll content of (c) mrs2-10 and Col-0, (d) sel1-10 and Ws, (g) cax1-1 and Col-0, or (h) cax1/cax3 and Col-0 plants in response to increasing concentrations of MgSO4·7H2O in soil medium. Bars indicate standard error, n = 72. The asterisks indicate statistically significant differences between genotypes (p<0.05) at specific concentrations of MgSO4·7H2O based on ANOVA.

