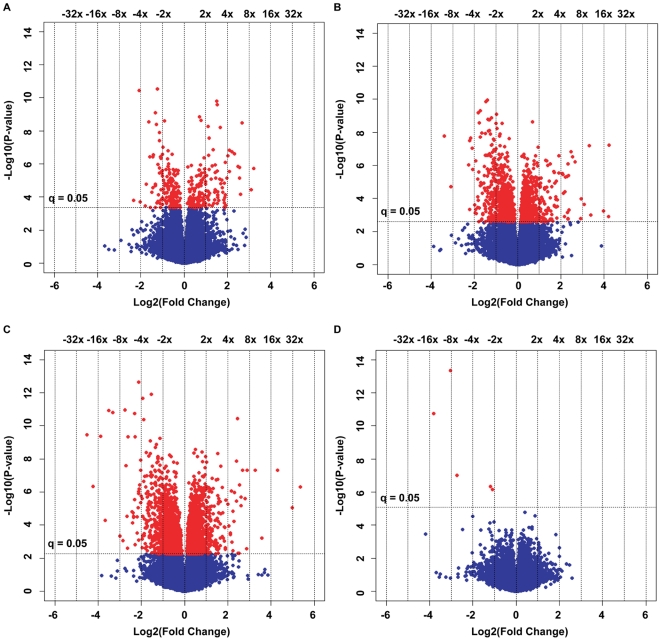
Figure 6. Volcano plots of gene expression comparisons at distinct timepoints.
(a) Time 45 (Col-0 treated for 45 min. vs Col-0 exposed to a control solution for 45 min.) (b) Time 90 (Col-0 treated for 90 min. vs Col-0 exposed to a control solution for 45 min.) (c) Time 180 (Col-0 treated for 180 min. vs Col-0 exposed to a control solution for 45 min.) (d) cax1-1 treated for 180 min. vs Col-0 treated for 180 min. The x-axes show log2 values of the fold changes in gene expression between sample sets. Each dot represents one of 37478 transcripts. Vertical lines indicate absolute fold change values as indicated on top of the graphs. The y-axes show the −log10 p-values corresponding to the log2 fold change values. The horizontal line indicates the −log10 p-value where the q-value is 0.05. Transcripts whose expression difference (fold change) corresponds to a p-value for which q<0.05 are above the horizontal line and indicated in red.

