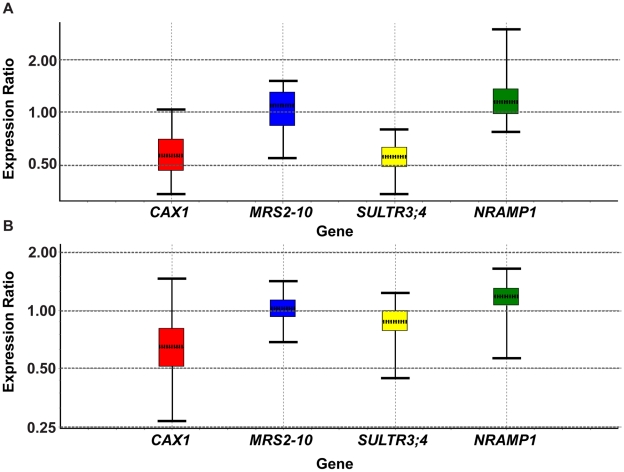
Figure 8. Whisker box plots representing gene expression ratio distributions for the Q-PCR analysis of four transporter genes.
The gene expression ratio distributions of transporter genes that showed significant differences in expression in the root transcriptome analysis of Col-0 treated for 180 min. vs Col-0 exposed to a control solution for 45 min are represented by Whisker box plots. Results show permutated expression data that are calculated by the REST 2008 statistical analysis software, which uses randomization techniques. The graphs give an impression of the expression ratio distribution per gene related to the results presented in Table 7. (a) RNA sources were the same as for the transcriptome analysis (Col-0 treated for 180 min. vs Col-0 exposed to a control solution for 45 min.). (b) RNA was extracted from Col-0 treated for 180 min vs Col-0 exposed to a control solution for 180 min. (diurnally controlled samples).

