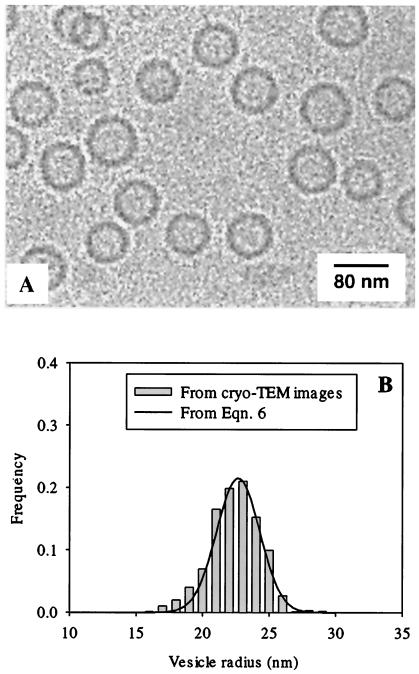
Figure 2.
(A) Cryo-TEM image of CTAB/FC7 (2 wt % total surfactant, CTAB/FC7 ratio of 2:8 by weight) vesicle system with a significantly more narrow size distribution than the CTAB/SOS vesicles in Fig. 1. All of the vesicles were unilamellar under these conditions. The vesicle phase exists on the FC7- (and FC5-) rich side at concentrations between ≈2 and 4 wt % surfactant and for mixing ratios greater than 80% FC7 (and FC5). (B) Vesicle size distribution histogram determined from the cryo-TEM images; the solid line is a fit to Eq. 6 with Ro = 23 nm and K = 6 ± 2 kBT.

