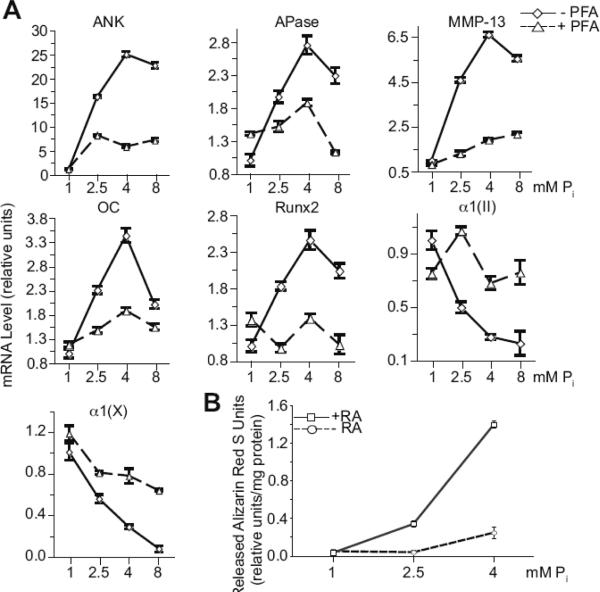
Figure 1.
(A) mRNA levels of hypertrophic and terminal differentiation markers, including ANK, APase, MMP-13, osteocalcin (OC), runx2 and type X collagen α1(X)), and type II collagen (α1(II)), and (B) mineralization of growth plate chondrocytes cultured in the presence of various concentrations of extracellular Pi(1, 2.5, 4, and 8mM) and in the absence (−PFA) or the presence of PFA (+PFA). (A) The levels of these hypertrophic and terminal differentiation marker and type II collagen mRNAs were determined after 2-day treatment with Pi by real-time PCR and SYBR Green and normalized to the 18S RNA levels. Data are means of triplicate PCRs using RNA from three different cultures; error bars represent standard deviations. (B) The degree of mineralization of growth plate chondrocyte cultures treated for 4 days with various concentrations of Pi(1, 2.5, 4mM) in the absence (−RA) or presence of 35nM RA (+RA) was determined using alizarin red S staining. To quantitate the alizarin red S stain each dish was incubated with cetylpyridinium chloride for 1h. The optical density of alizarin red S stain released into solution was measured at 570 nm, and normalized to the total amount of protein. Data are means of four experiments; error bars represent standard deviations.

