Figure 2.
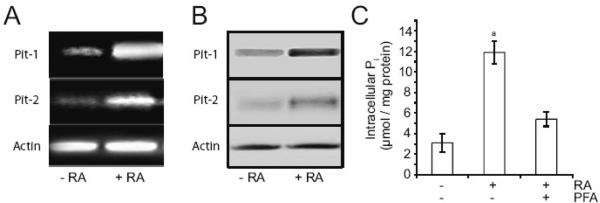
mRNA (A) and protein levels (B) of Pit-1 and Pit-2, and intracellular Pi concentration (C) of growth plate chondrocytes cultured in the absence or presence of RA and/or PFA. (A, B, C) Growth plate chondrocytes were cultured for 2 days in the presence of 1mM Pi and in the absence or presence of 35nM RA and/or 1mM PFA. (A) Pit-1 and Pit-2 mRNA levels as determined by PCR using primers (described in “Materials and methods”) encoding Pit-1, Pit-2, or actin. (B) Immunostaining of cell extracts for Pit-1, Pit-2 and actin was performed using antibodies specific for Pit-1, Pit-2, and actin. (C) Intracellular Pi concentrations of growth plate chondrocytes as determined per the method described in “Materials and methods.” Data are means of four experiments; error bars represent standard deviations. ap < 0.01 vs. untreated cells.

