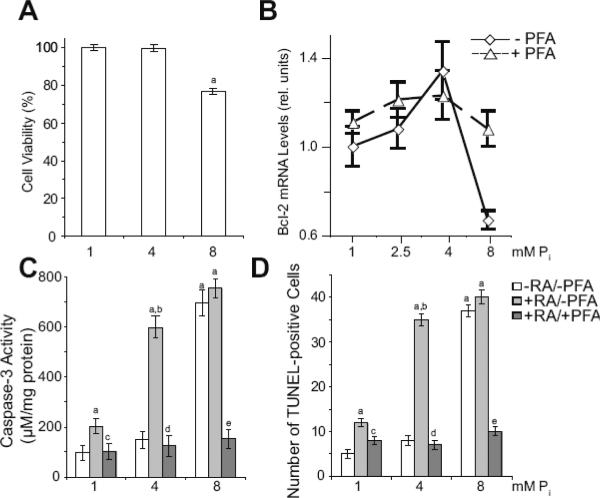
Figure 6.
Apoptosis of growth plate chondrocytes treated with various concentrations of extracellular Pi in the absence or presence of RA and PFA. (A) Cell number of growth plate chondrocytes cultured in the presence of 1, 4, and 8mM extracellular Pi for 4 days. Cell number was determined using the CCK-8 assay; cell number of cells cultured in the presence of 1mM Pi was set to 100%. Data are means of four experiments; error bars represent standard deviations (ap < 0.01 vs. 1mM Pi-treated cells). (B) The levels of bcl-2 mRNA were determined after 2-day treatment with various Pi concentrations (1, 2.5, 4, 8mM) in the absence (− PFA) or presence of PFA (+ PFA) by real-time PCR and SYBR Green and normalized to the 18S RNA levels. Data are means of triplicate PCRs using RNA from three different cultures; error bars represent standard deviations. (C) Caspase-3 activity of growth plate chondrocytes cultured in the presence of various concentrations of extracellular Pi (1, 4, 8mM) and in the absence of RA and PFA (−RA/−PFA), presence of RA and absence of PFA (+RA/−PFA), or presence of RA and PFA (+RA/+PFA) for 4 days. Caspase-3 activity was measured and normalized to the total protein concentration. Data are means of four experiments; error bars represent standard deviations (ap < 0.01 vs. 1mM Pi-treated cells; bp < 0.01 vs. 4mM Pi-treated cells; cp < 0.01 vs. 1mM Pi/RA-treated cells; dp < 0.01 vs. 4mM Pi/RA-treated cells; ep < 0.01 vs. 8mM Pi/RA-treated cells). (D) Percent TUNEL-positive cells among growth plate chondrocytes cultured as in (C) as determined by flow cytometric analysis. Data are means of four experiments; error bars represent standard deviations (ap < 0.01 vs. 1mM Pi-treated cells; bp < 0.01 vs. 4mM Pi-treated cells; cp < 0.01 vs. 1mM Pi/RA-treated cells; dp < 0.01 vs. 4mM Pi/RA-treated cells; ep < 0.01 vs. 8mM Pi/RA-treated cells).

