
Figure 2.
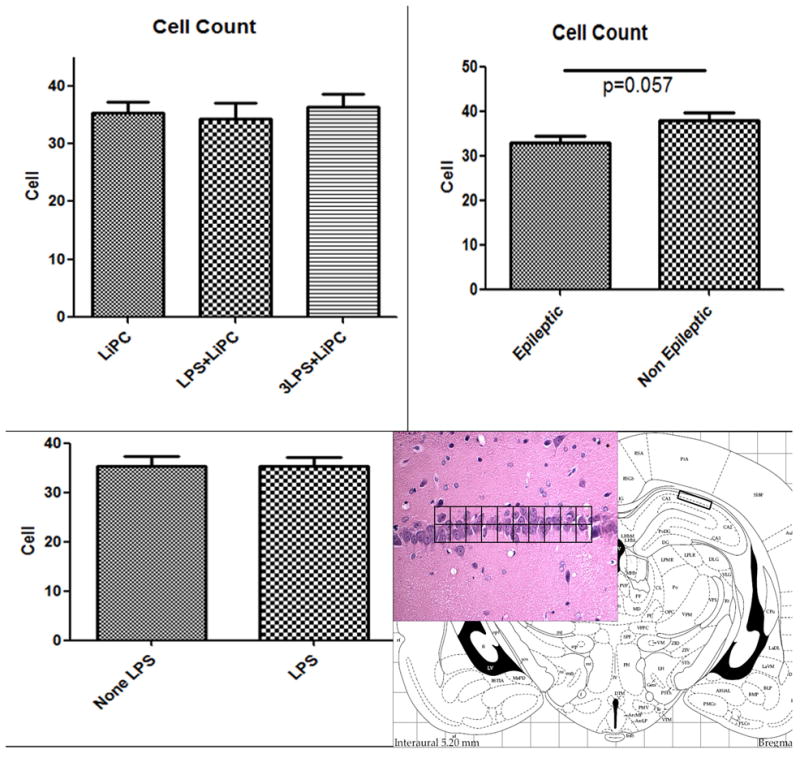
Histograms of the number (mean ± SEM) of pyramidal cell in CA-1 counted using a grid. A: pyramidal cell counts in CA-1 in the three studied groups. B: pyramidal cell counts in CA-1 comparing epileptic animals versus non-epileptic animals. C: pyramidal cell counts in CA-1 comparing LPS-treated versus non-LPS-treated animals. D: Hematoxylin & Eosin stained brain section taken at the level of the hippocampus representing the areas where the cell counts were performed.