
Figure 3.
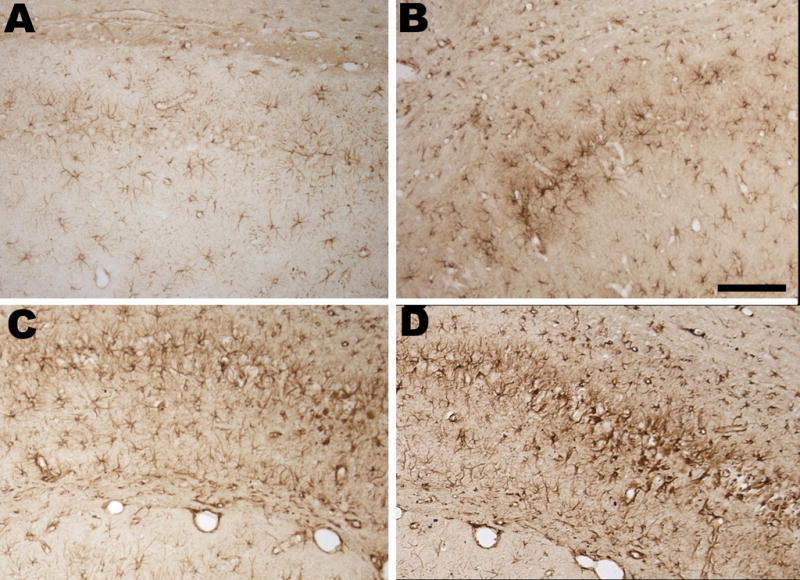
GFAP-Immunostaining in the hippocampus. A: CA-1 of a rat from control group. B: CA-1 of a rat from LiPC group at higher magnification showing a moderate gliosis. C: CA-1 of a rat from LPS+LiPC group at higher magnification showing strong reactive gliosis. D: CA-1 of a rat from 3LPS+LiPC group at higher magnification showing strong reactive gliosis. Note in both C and D panel the aspect of the glial cells that are hypertrophic with thick processes.