Fig. 3.
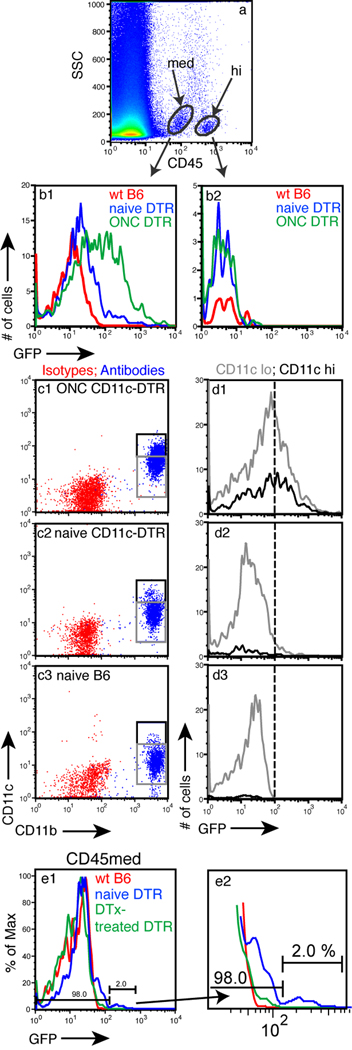
The retinal CD45med population contains the GFP+CD11c+ cells. (A) FACS analysis of retinal cell suspensions showing distinct CD45+ populations. (B1 and B2) GFP expression in the CD45med and CD45hi populations from retinas of CD11c-DTR mice (blue), control B6 mice (red), and CD11c-DTR mice 7 d following an ONC (green). (C) FACS analysis of the CD45med population for CD11b and CD11c from the indicated mice. (D) Analysis of GFP levels in the CD11b+CD11clo (gray box) and CD11b+CD11chi (black box) populations. (E1) Injection of DTx into the eye depletes the GFP+ population. (E2) Enlargement of profile showing detail of the DTx-depleted and control populations.

