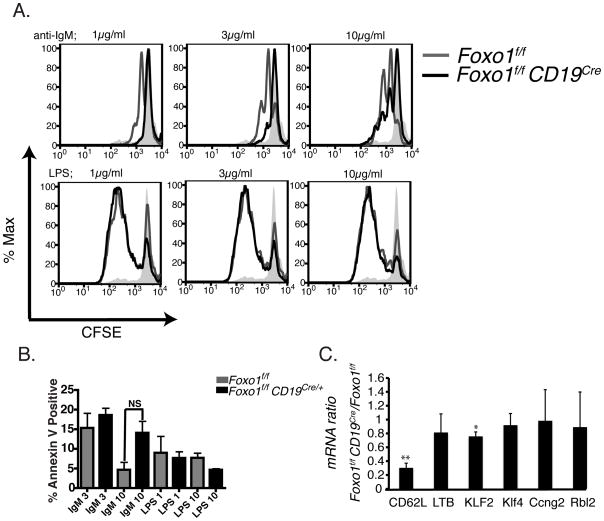
Figure 2.
Comparison of proliferation, apoptosis and gene expression. (A) Purified B cells from Foxo1f/fCD19Cre and control Foxo1f/f mice were labeled with CFSE, then stimulated with anti-IgM or LPS at the indicated concentrations for 66 h at 37 °C. Filled gray histogram shows unstimulated control cells. Similar results were obtained in 4 separate experiments. (B) In 3 of the CFSE labeling experiments, cells were stained at 66 hr with Annexin V to quantitate apoptotic cells among the divided population. Data show mean + SD. Unpaired two-tailed t-tests showed no significant differences between genotypes (p>0.05 for all comparisons; p = 0.055 for comparison labeled “NS”). (C) Quantitative real-time PCR (qRT-PCR) data using RNA extracted from B cells of Foxo1f/fCD19Cre and control Foxo1f/f mice. The numbers indicate the ratio of each gene in Foxo1f/fCD19Cre as compared to Foxo1f/f mice, after normalization to βactin. Data show mean + SD of three separate experiments. *p<0.05; * p<0.01; comparing ratio of each gene to 1.0 using a one-tailed t-test.

