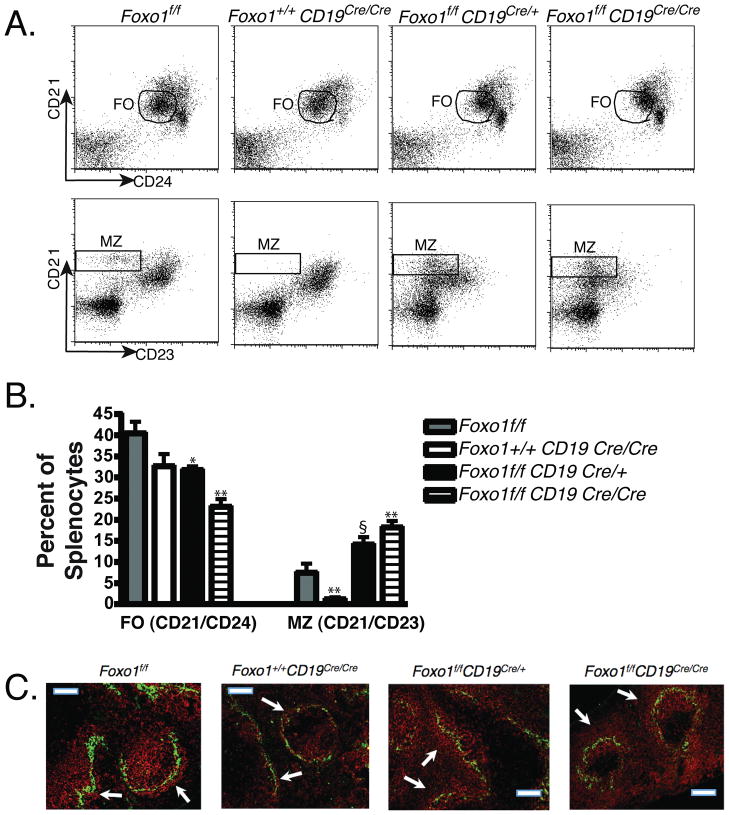
Figure 3.
Assessment of complementation of the MZ B cell defect in CD19-deficient mice. (A) Flow cytometry was used to compare FO and MZ B cell percentages from representative mice. B220-gated cells were analyzed for CD21 and CD24 to quantitate FO cells (CD21intCD24int), or CD21 and CD23 to quantitate MZ cells (CD21hiCD23lo). (B) The percentages of FO and MZ cells in the spleens from mice of each genotype are shown. Data represent mean ± SD, n = 3-5 mice. *p<0.05; **p<0.01 vs. Foxo1f/f, using unpaired, two-tailed t-test. §p = 0.051 vs. Foxo1f/f. (C) Immunofluorescent staining of spleen sections was done as in Figure 1B.

