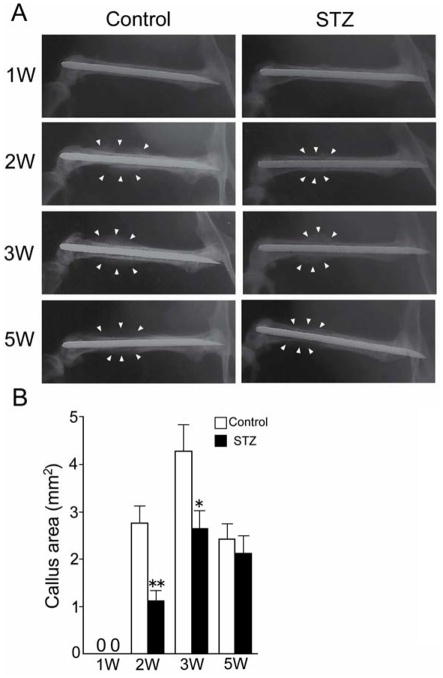
FIG. 1.
Callus area on bone radiographs. (A) A 23-gauge needle was inserted into the right femur of the mouse for internal fixation; the bone was then fractured by blunt trauma. Bone radiographs of the right femur were taken every week after fracture. Left panels show the control group, right panels show the streptozotocin (STZ) group. Radiographs are shown of one mouse from each group at each time point. Arrowheads indicate bone callus. (B) The callus areas on bone radiographs were measured by Image J. Data are mean ± SEM. *: p < 0.05. **: p < 0.005.

