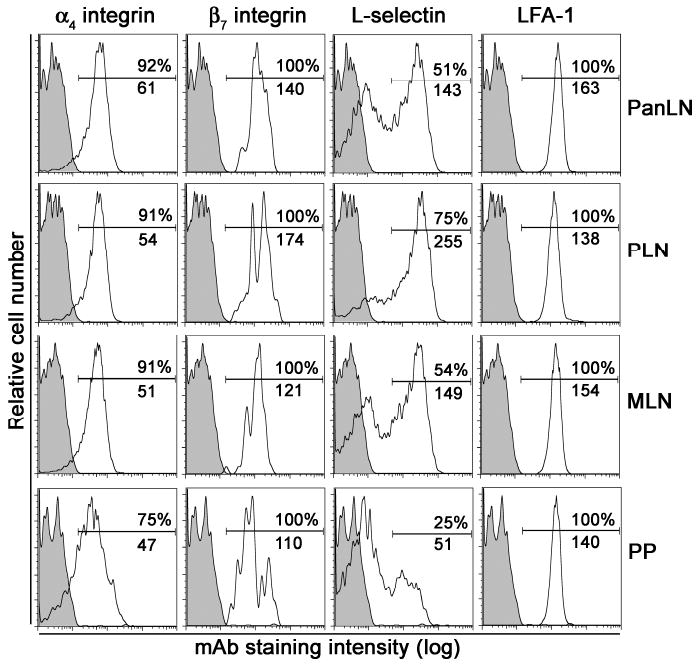
Figure 1. Expression of adhesion molecules on PanLN B cells.

Lymphocytes were isolated from PanLN, PLN, MLN and PP of 3-4-wk-old female NOD mice, stained with a FITC-anti-B220 mAb combined with a PE-conjugated mAb to α4 integrin, β7 integrin, L-selectin or LFA-1, or a PE-conjugated negative control mAb, and evaluated by FACS analysis. The histograms in each panel show the staining with the anti-lymphocyte adhesion molecule mAb (unshaded) and the isotype control mAb (shaded) on B220+ B cells. The numbers in each panel indicate the percentage of B cells that express each adhesion molecule (top) and the mean fluorescence intensity of the B cell staining (bottom). Data are one representative of three experiments. In each experiment, lymphocytes were pooled from 3-4 mice.
