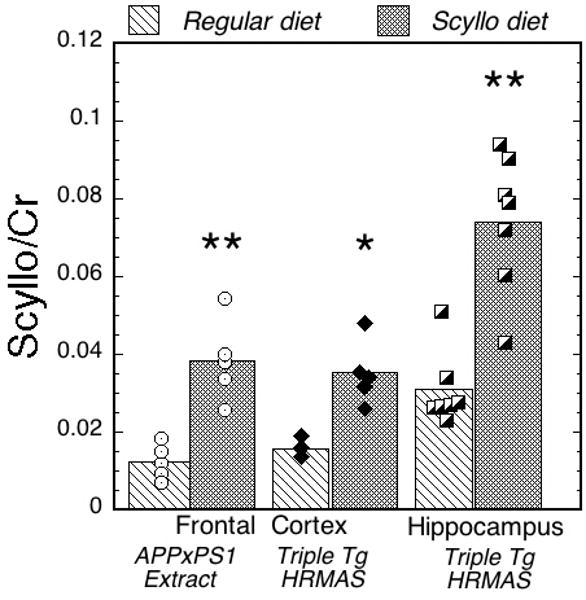
Figure 3.

Bar graph showing the increase in scyllo-inositol in the scyllo-fed versus regular diet animals normalized to creatine. Values shown are molar ratios. The data come from brain extracts of frontal cortex in APP×PS1 mice and frontal cortex and hippocampus using HRMAS in APP×PS1×tau mice. The scyllo-inositol increases by about a factor of 2-3 in the two groups.
