
Fig. 8.
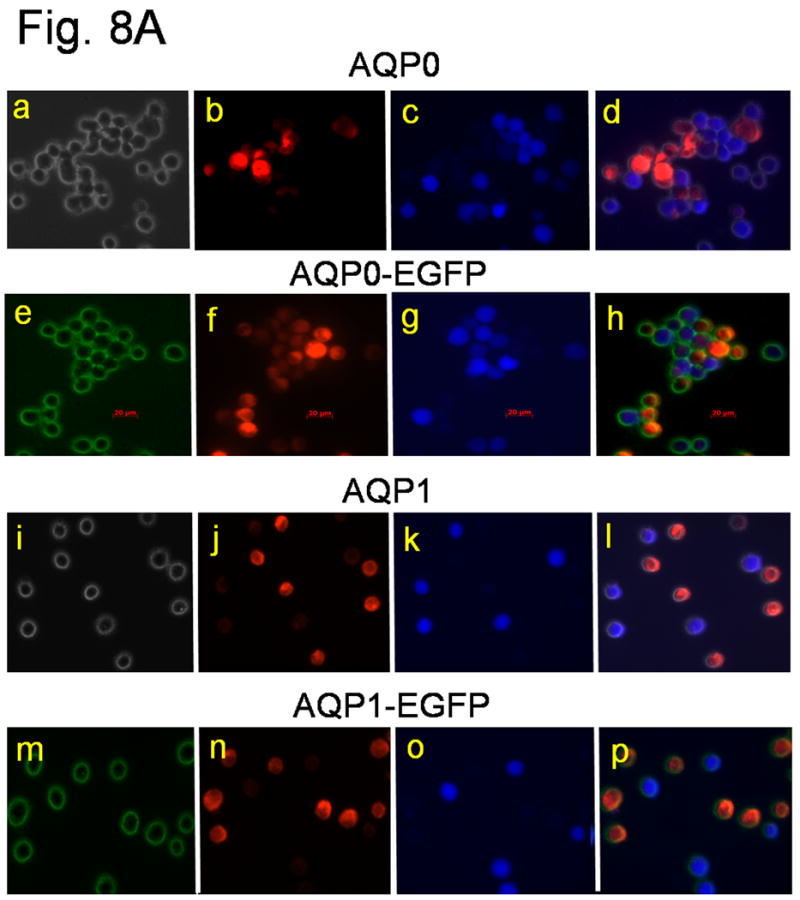
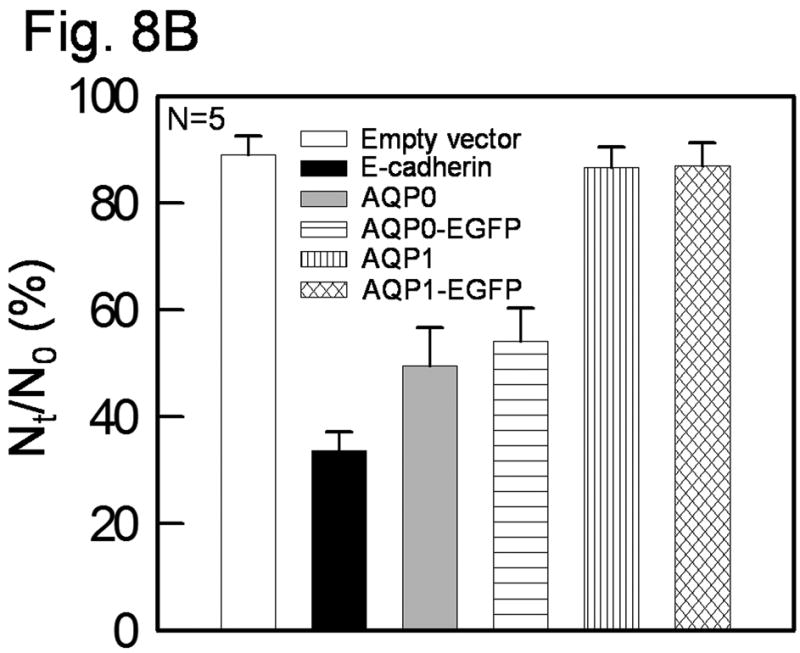
Cell aggregation assay using rotary gyratory shaker. (A) Bi-color fluorescence aggregation assay using L-cells expressing mouse AQP0 (a-d), AQP0-EGFP (e-h), human AQP1 (i-l) and AQP1-EGFP (m-p). (a) and (i), phase contrast images; others epifluorescent images. (e) and (m), fluorescence due to EGFP tag. (b, f, j, n), cells loaded with CellTracker Red; (c, g, k, o) cells loaded with CellTracker Blue. d, h, l and p merged images of (a,b,c), (e,f,g), (i,j,k) and (m,n,o), respectively. (B) Histogram showing cell aggregation induced by adhesion deficient L-cells expressing mouse AQP0 with or without EGFP tag and human AQP1 with or without EGFP tag and E-cadherin (positive control), after 90 min. of incubation on a gyratory shaker.