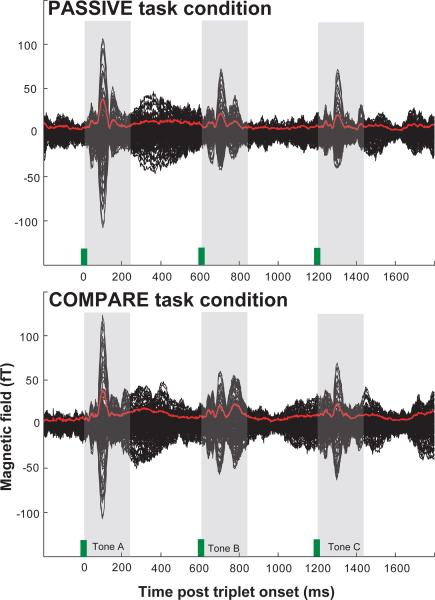
Figure 2.
Illustration of response data. Grand-average (average over all subjects for each of the 160 channels; in black) of the evoked cortical responses to one stimulus condition [A ≈ 400 Hz, B ≈ 800 Hz, C ≈ 400 Hz] in the PASSIVE (top) and COMPARE (bottom) task conditions. The root mean square (RMS) over all channels is plotted in red. Tone onsets are marked with green bars. The M100 onset responses to A, B and C tones are clearly seen at 100, 700 and 1300 ms (shaded).

