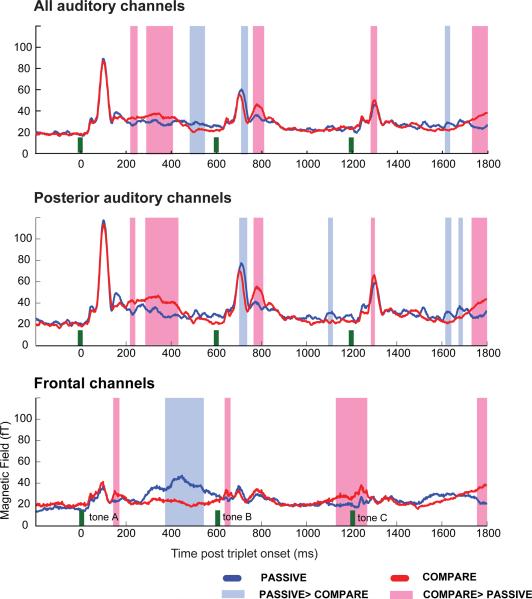
Figure 3.
The RMS time course of composite (averaged across triplet conditions and hemispheres) COMPARE and PASSIVE amplitudes recorded from all auditory (top), posterior auditory (middle) and frontal (bottom) channels. Tone onsets are marked with green bars. Statistically significant differences between COMPARE (red) and PASSIVE (blue) amplitudes are marked with pink (COMPARE > PASSIVE) or light-blue (PASSIVE > COMPARE) shading.

