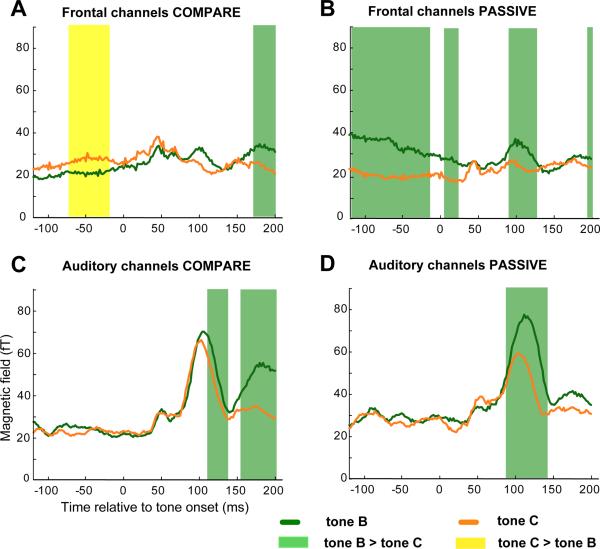
Figure 4.
Comparison of tone B and tone C activation. The RMS time course of composite (averaged across triplet conditions and hemispheres) tone B (green) and C (orange) amplitudes recorded from frontal (top) and auditory (bottom) channels in the COMPARE (left) and PASSIVE (right) tasks. Tone onsets are at 0 ms on the x axis. Statistically significant differences between B and C amplitudes are marked with green (B > C) or yellow (C > B) shading.

